Plot of diffuse horizontal irradiances for the six design reference year (DRY) 2001-2010 irradiance stations. Diffuse horizontal irradiance is scattered solar irradiance reaching the surface that does not come directly from the Sun. The DRY months selected from the 2001-2010 period are: January 2009, February 2009, March 2006, April 2010, May 2006, June 2005, July 2009, August 2009, September 2009, October 2008, November 2010, December 2009.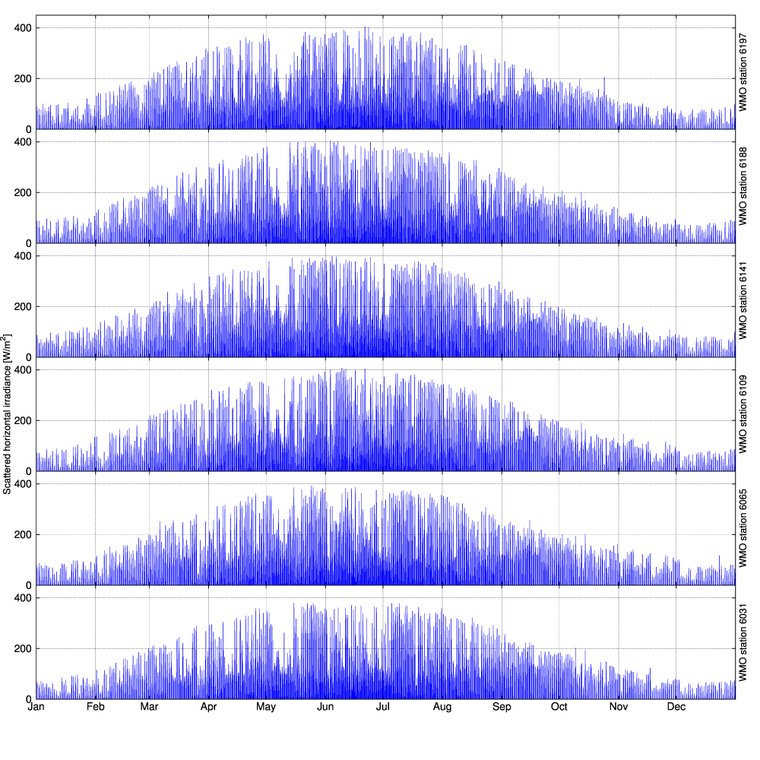 |
The diffuse irradiances were derived for the DRY 2001-2010 data set (Wang et al. 2012; 2013). This was necessary since DMI currently do not measure diffuse irradiances at their meteorological stations.
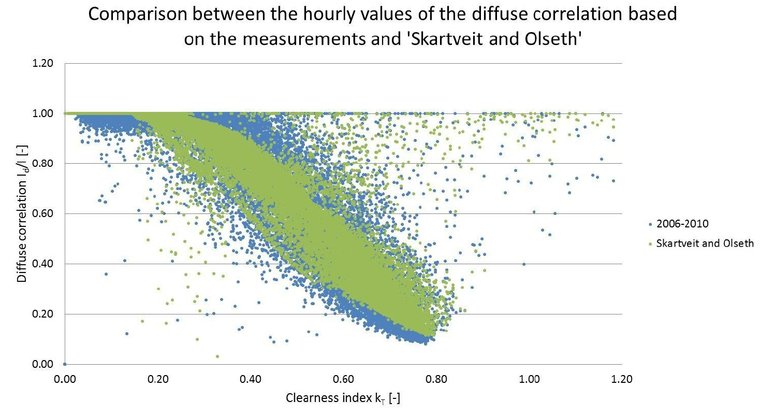
At the DTU climate station both diffuse horizontal irradiances and global horizontal irradiances have been measured since 1989. Thus, this data set was analysed to estimate how well the diffuse irradiance best could be derived from the measured global irradiances. Dragsted & Furbo (2012) found the method of Skartveit et al. (1998) to be the best, and this method was chosen for the derivation of diffuse horizontal irradiances at the DRY stations. In the two figures below comparisons of the Skartveit et al. diffuse irradiance fraction model with the measured irradiances are shown. More details on the comparisons performed at DTU can be found in the report by Dragsted & Furbo (2012).
Plot of five years (2006-2010) of measured hourly irradiances at the DTU climate station compared with data from the diffuse irradiance model of Skartveit et al. (1998). The plot shows the ratio of the diffuse irradiance to the global irradiance on the y-axis as a function of the clearness index on the x-axis. The clearness index is defined as the fraction of global horizontal irradiance reaching the surface relative to the horizontal irradiance at the top of the atmosphere. The figure comes from the technical report of Dragsted & Furbo (2012).
 |
This plot shows the same data as the plot above, only in this plot the data have been smoothed in the clear sky index dimension (the x-axis) in order to make the average relation between the diffuse irradiance fraction and the atmospheric transmittance clearer. The figure comes from the technical report of Dragsted & Furbo (2012).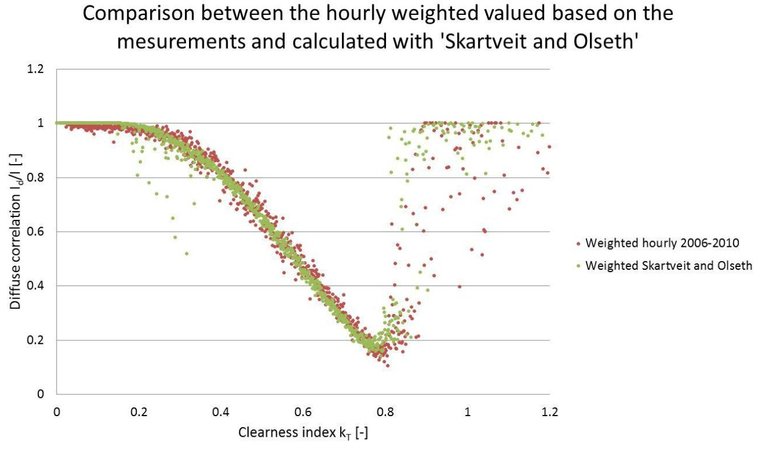 |
- Dragsted, J. & S. Furbo: "Solar radiation and thermal performance of solar collectors for Denmark," DTU Report R-275, DTU, Kgs. Lyngby, Denmark, 2012.
- Skartveit, A., J. A. Olseth & M. E. Tuft: "An hourly diffuse fraction model with correction for variability and surface albedo," Solar Energy, 1998; 63 (3): 173-183.
- Wang, P. R., M. Scharling & K. P. Nielsen: "2001 - 2010 Design Reference Year for Denmark," beta.dmi.dk/fileadmin/Rapporter/TR/tr12-17.pdf, Technical Report 12-17, DMI, Copenhagen, Denmark, 2012.
- Wang, P. G., M. Scharling, K. P. Nielsen, K. B. Wittchen & C. Kern-Hansen: "2001 - 2010 Danish Design Reference Year - Reference Climate Dataset for Technical Dimensioning in Building, Construction and other Sectors," www.dmi.dk/fileadmin/user_upload/Rapporter/TR/2013/TR13-19.pdf, Technical Report 13-19, DMI, Copenhagen, Denmark, 2013.